

Climate risk in Tokyo
Japan
Main risks in Tokyo
On tropical cyclones and earthquakes, Tokyo ranks above at least 93% of the world's 626 large cities.
- Tropical cyclones
- once in 100 years, winds of about 170 km/h (category 2) [1]
- Higher than 96% of the world's large cities; 5th of 11 large cities in Japan.
- For comparison: Chennai 186 km/h, Guangzhou 171 km/h, Fort Lauderdale 167 km/h.
- Earthquakes
- severe shaking on firm ground (0.37 g), more on soft ground [2]
- Higher than 93% of the world's large cities; 5th of 11 large cities in Japan.
- For comparison: Santiago 0.4 g, Quezon City 0.39 g, Irvine 0.36 g.
- g is the pull of gravity: from about 0.1 g, shaking is strong and can cause light damage to buildings.
















 0.37 g Natural Earth
Earthquake shaking on firm ground, 10% chance in 50 years
This week in Tokyo
This week's forecast risk around the city, by day and by hour, and the hazard events near it now. [3] [4] [5] [6] [7]
This week's forecast for the city cannot be shown here right now.
Open the city on the mapThe Earth right now
The Earth's pulse reads the whole world, not this city, so it is the same on every city's page.
Earth's pulse, from 0 to 100. It rises with the number of people in the path of disasters now under way; 90 matches the 2004 tsunami.
Open the live mapWhere else Tokyo stands out
10%
Share of land sinking over 1 cm a year, within 15 km [8]
Higher than 91% of the world's large cities; 1st of 11 large cities in Japan.
For comparison: Lahore 20%, Faridabad 15%, Manila 14%.
Around the city on the map
Sinking land







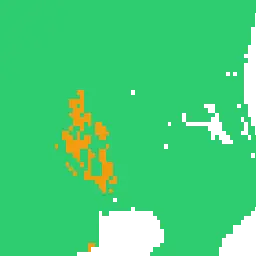





 Natural Earth
Tokyo's climate in the 2050s
2041-2060 compared with 1991-2020, if emissions level off [9] [10]
By the 2050s, Tokyo is projected to have the climate that Fukuoka (Japan) has today.
+1.5 °C
Mean temperature over the year
+1.6 °C
Average daily high, warmest month
+1.2 °C
Average nightly low, coldest month
0%
Precipitation over the year
If emissions keep rising, Tokyo would have the climate that Wenzhou (China) has today.
Share this comparison
Climates are compared on seasonal temperature and rainfall alone, each difference weighed against the city's usual swings from year to year (the method of Mahony et al. 2017); heat waves, the heat of city streets and the rising sea are left out. 2 of the 3 estimates from the climate models, the middle one and the two ends of their range, point to Fukuoka. [11]
Everything else measured
From the highest among the world's 626 large cities to the lowest.
| Reading | Tokyo | Among 626 large cities | Rank in Japan (1 = highest) |
|---|---|---|---|
| Hot days in 2025, over 35 °C [12] | 27 days | higher than 70% of large cities | Rank in Japan (1 = highest): 2 of 11 |
| Warming by 2050, if emissions level off [10] | +2.2 °C | higher than 70% of large cities | Rank in Japan (1 = highest): 5 of 11 |
| Days with 20 mm of rain or more in 2025 [12] | 14 days | higher than 68% of large cities | Rank in Japan (1 = highest): 8 of 11 |
| Sea level rise by 2050 over the 1995-2014 average, if emissions level off [13] | 21 cm, 16 cm of it after 2020 | higher than 63% of large coastal cities | Rank in Japan (1 = highest): 2 of 11 |
| Hottest day of 2025 [12] | 37.7 °C | higher than 60% of large cities | Rank in Japan (1 = highest): 3 of 11 |
| Tropical nights in 2025, over 20 °C [12] | 116 nights | higher than 55% of large cities | Rank in Japan (1 = highest): 5 of 11 |
| Water stress [14] | Medium-High: 20 to 40% of the available water drawn | the same grade as 13% of large cities; higher than 43%, lower than 44% | |
| Drought risk [14] | Medium-High | the same grade as 38% of large cities; higher than 12%, lower than 50% | |
| River flood depth, 100-year event [15] | Dry at the centre; other districts can flood | like 85% of large cities | |
| Share of the land around the centre (a 10 km square) that a 100-year flood from the sea puts under 0.5 m of water or more [15] | 0% today and by 2080 if emissions keep rising | like 74% of large coastal cities | |
| Land burned in an average year [16] | 0% | like 84% of large cities |
- Flood depth is given for one 1 km square at the city centre, in today's climate.
- Water stress is the share of the available water drawn every year. Drought risk is how often droughts come, against the area's own usual rain, and how many people and how much farmland they would reach. Both are graded on WRI's own scale.
- Sea level rise is the IPCC projection for the nearest coast, counted from the 1995-2014 average. It is on a grid about 100 km across and counts the slow rise or fall of the land. "If emissions level off" is the IPCC's SSP2-4.5 scenario.
- Water stress and drought risk have no rank in the country: they are steps of a scale, and many cities share one.
- Tsunamis and landslides are not rated for a single city here.
Sources
- IRIS: the Imperial College Storm Model dataset: tropical cyclone wind
- GSHAP Global Seismic Hazard Map: earthquake shaking
- Environment and Climate Change Canada: Global Deterministic Prediction System (GDPS): the week's forecast map
- EMSC-CSEM SeismicPortal: earthquake near the city now
- GDACS - Global Disaster Alert and Coordination System: earthquake near the city now
- Japan Meteorological Agency: coastal hazard and windstorm near the city now
- USGS Earthquake Hazards Program: earthquake near the city now
- Global Land Subsidence Mapping Reveals Widespread Loss of Aquifer Storage Capacity: sinking land
- TerraClimate: the 2050s comparison
- NASA Earth Exchange Global Daily Downscaled Projections (NEX-GDDP-CMIP6): the 2050s comparison, warming
- Mahony, Cannon, Wang and Aitken (2017). A closer look at novel climates: new methods and insights at continental to landscape scales. Global Change Biology 23, 3934-3955: how climates are compared
- ERA5 Single Levels Daily Statistics: hot days, heavy rain, hottest day, nights
- IPCC AR6 Sea Level Projections: sea level rise
- Aqueduct 4.0 Water Risk Framework: water stress, drought risk
- Aqueduct Floods Hazard Maps: river flood depth, coastal floods
- Global Biomass Burning at 500 m (GFED500): burned land
Cite or embed
Cite this page
In a line
Source: Criora (criora.com), based on IRIS, GSHAP, ECCC, EMSC-CSEM SeismicPortal, GDACS - Global Disaster Alert and Coordination System, Japan Meteorological Agency, USGS Earthquake Hazards Program, HydroShare, TerraClimate, NEX-GDDP-CMIP6, ECMWF, IPCC, WRI, GFED500
APA
Criora. (2026). Tokyo, Japan: climate risk profile [Data set]. Retrieved November 4, 2026, from https://criora.com/atlas/JPN/tokyo BibTeX
@misc{criora_atlas_JPN_tokyo_2026,
  author = {{Criora}},
  title = {Tokyo, Japan: climate risk profile},
  year = {2026},
  url = {https://criora.com/atlas/JPN/tokyo},
  urldate = {2026-11-04}
} The figures may be reused on the terms of their sources, which this page names.
Embed on your site
Free, no account needed. The widget has no script and shows the figures of this page. Keep its link to the source.