Financial impact estimates
Criora estimates the damage river flooding, coastal flooding and tropical cyclone wind may do to a building or asset at a point: its expected annual damage and the damage of the 50, 100, 200 and 500-year events, as a share of its value and in money, low to high, today or in 2050 and 2080. This page says what an estimate rests on, how it was checked and where it can mislead. Every answer carries its own assumptions, sources and caveats.
What an estimate rests on
- The hazard. Flood depths at nine return periods from WRI’s Aqueduct Floods, river and coast, today and under RCP4.5 and RCP8.5 in 2050 and 2080. Cyclone wind speeds at their return periods from IRIS, Imperial College London’s storm model, today and in 2050 under SSP2-4.5 and SSP5-8.5, the scenarios that match the floods’ two; IRIS has no 2080.
- The defences. The flood protection standard FLOPROS gives the place, unless the request gives its own in
protection_rp. A flood more frequent than the standard does no damage. - The damage. The share of its value an average building of the asset’s class on its continent loses at each flood depth, from the JRC’s global depth-damage curves (Huizinga et al. 2017). For wind, Emanuel’s damage function with its regional calibration by Eberenz et al. (2021).
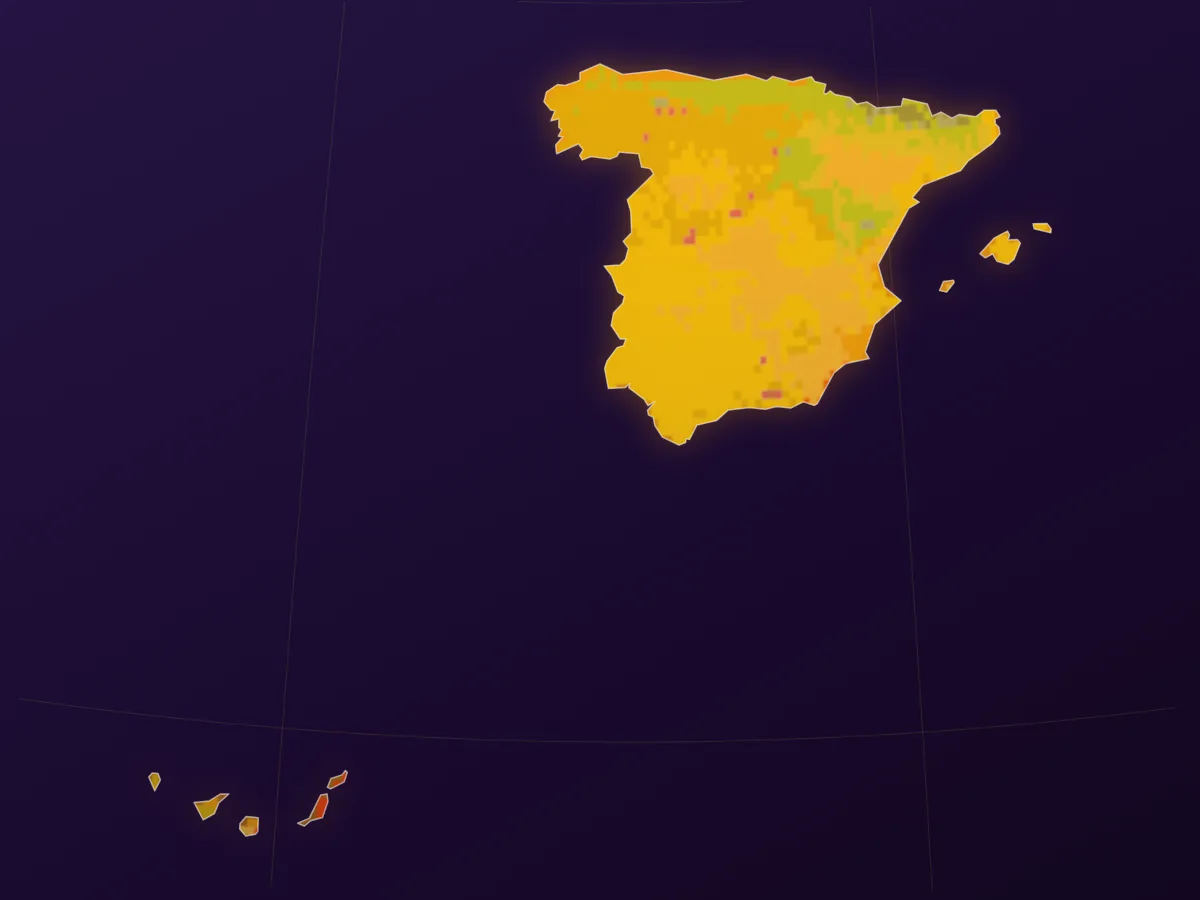
- The value. The asset’s value, where the request gives one. Otherwise, for a home, a shop or office, or a factory, the replacement cost of the buildings of that use in its 1 km cell: their built volume from GHS-BUILT-V 2025, the European Commission’s Joint Research Centre’s grid, priced country by country from Europe’s measured national building stocks (Paprotny 2025) and, elsewhere, from the JRC’s construction costs by income (Huizinga et al. 2017) with the World Bank’s GDP per capita. It is the cost to rebuild, in euros, not a market price.
- The year. Expected annual damage weighs the damage at every return period by how often it comes. The damage of a 100-year event is what one such event would do.
Bands and material flags
Every estimate rates its expected annual damage on XDI’s published scale of annual damage as a share of replacement cost, the scale the Climate Council’s Uninsurable Nation (2022) also uses:
| Band | Annual damage, as a share of the value |
|---|---|
| Low | below 0.2% |
| Moderate | 0.2% to 1% |
| High | 1% or more |
annual_damage_risk_band rates the hazards’ sum, and material_physical_risk_flags rates each hazard and calls it material from the moderate band. XDI rates an asset’s highest damage to date; Criora applies the same bands to the scenario and year asked.
Each flag also names its hazard as Appendix A to the EU Climate Delegated Act lists it, and its family, acute or chronic, as EBA Pillar 3 files exposures. Of Appendix A’s 28 hazards the estimate counts cyclones, hurricanes and typhoons, and part of two more: floods, from rivers and the sea but not from rain or groundwater, and sea level rise, through the coastal floods of the futures. The whole table, hazard by hazard, is served at GET /api/v1/meta/methodology. The answer files the place under its country (location.iso3) and its first-order subdivision, the state, province, region or department it is in, with the subdivision’s ISO 3166-2 code from Natural Earth (location.subdivision), so exposures can be grouped by geography as disclosures ask. Which disclosure datapoints these fields answer: Financial estimates in disclosures.
How far it can be relied on
- The damage arithmetic gives the same expected annual damage as OS-Climate’s open-source physrisk, within 2%, on the same places.
- The cost of building in a country whose stock Europe’s figures do not measure is drawn from income. Tried on the measured countries, each in turn left out, it lands within a factor of 1.47 of the measured cost in the median country.
- Against WRI Aqueduct Floods’ own country figures for 20 countries on six continents, both without defences, Criora’s annual river flood damage as a share of the value of buildings is 49% of Aqueduct’s in the median country, between 37% and 76% in the middle half of them. Coastal damage is 17% of Aqueduct’s in the median country.
- Both read the same flood depths through the same JRC curves. Aqueduct counts value only in urban areas, on a map it has not published, so the gap cannot be traced place by place. With defences the two differ more widely, since Aqueduct applies one protection standard to a whole state or country and Criora the standard FLOPROS gives each place.
Limits
Open damage models differ from each other by two to five times. low and high span the climate
models or the sea level percentiles, the bounds of the protection standard and the curve’s own
spread where the JRC gives one: read them, not the central value alone.
- An estimate is indicative, for screening and disclosure. It is not for underwriting, pricing or valuing a single building, and it is not financial, investment or insurance advice.
- A curve is the average building of its class on its continent, not this building, its floors or its materials.
- River and coastal floods and cyclone wind only. Rain flooding, storm surge beyond Aqueduct’s coastal floods and every other hazard are not counted.
- The damage of a return period is per site and does not add up across sites to a portfolio’s loss at that return period. Expected annual damage does add up.
- Where the World Bank publishes no GDP per capita, such as for Taiwan and North Korea, there is no replacement cost: give
asset_value. Transport, roads and farmland have none either. - Each caller may ask for 300 estimates an hour; past that the answer is 429 with
Retry-After. - Every change to the method is a new methodology version with its entry in the changelog. The tools and their fields: API and AI agents.