The Earth’s pulse
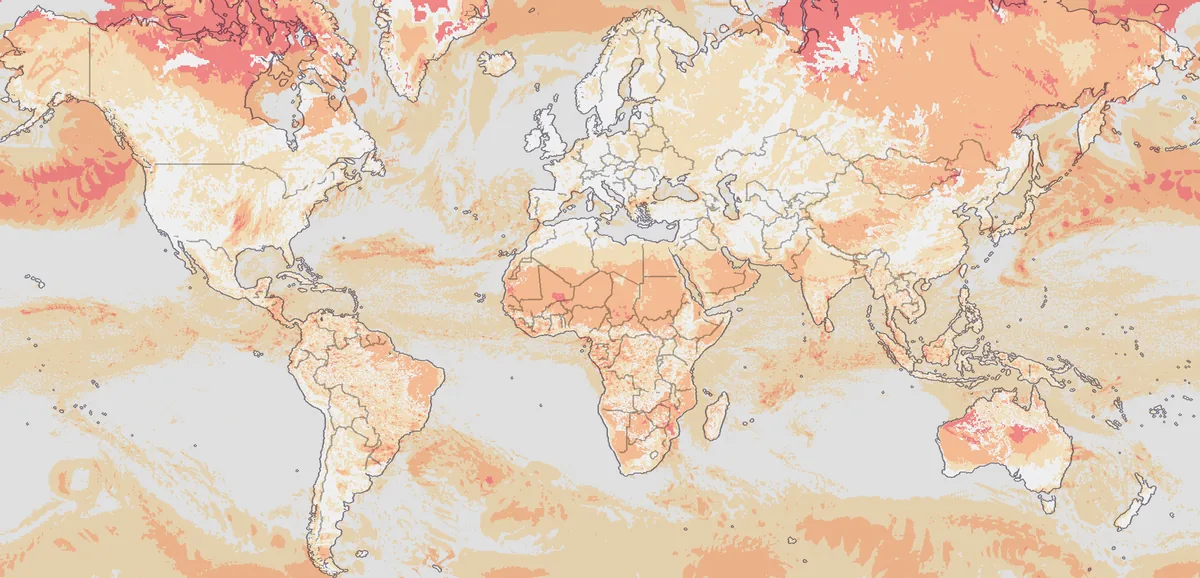
The dial above the map and on the atlas’s pages carries one figure from 0 to 100: how many people on Earth are within reach of what is happening now, across every hazard at once. Round the figure is the last 30 days, a hair for every eight hours, longer where something strong arrived. Pressing it opens the list of what matters now on the map.
What it reads
The people in the zone of risk: those an event may yet touch. It is known the moment an event is reported, where the count of the dead comes days later, so the figure reads reach and not losses.
- Every event the map shows as happening and an issuer has graded: earthquakes, tropical storms, floods, fires, eruptions and volcanoes’ alert levels, and air quality.
- People are counted on the ground the event damages: for an earthquake, where the shaking can damage buildings; for a storm, where its winds are destructive rather than everywhere it blows.
- An event counts for more the higher its issuer rates it, so a minor warning over a city does not read as a catastrophe.
- The scale is logarithmic: each step up stands for many times more people than the last, so the top of it stays for what the world remembers. 90 is a disaster on the scale of the Indian Ocean’s in 2004. 0 is a quiet Earth: only the small events always under way somewhere.
- A long list of ungraded events does not lift it, so a new source does not read as a disaster.
- An event weighs less as days pass after it was last reported active, and a volcano’s alert level counts from the day it was raised. A long event that has stopped growing fades too, even while it is still reported.
- Droughts are not in it: their area holds the people who live there rather than the people they harm. Official warnings are not in it either: how many a country issues depends on its warning service.
Criora reads the figure every five minutes and keeps each reading with the event that weighs most in it, so the figure’s history is its own. The sentence beside the dial says how many people stand in the zone of events their issuers rate moderate or above.
Levels
| Level | From | Days a year |
|---|---|---|
| Critical | 90 | 0 to 1 |
| High | 80 | 0 to 11 |
| Medium | 50 | 4 to 87 |
| Low | 25 | |
| Very low | 0 |
The last column says on how many days a year the day’s highest reading reached the level or a higher one, as the lower and the higher of two replays of the figure on past events: Criora’s own archive of recent months, and the Orange and Red alerts GDACS has issued since 2005. Below Medium the older archive, which holds only the larger events, cannot say.
Past events on this scale: the Indian Ocean in 2004 stands at 90, Tohoku in 2011 at 89, Turkey and Syria in 2023 at 75.
How far it can be relied on
- It measures reach, not harm. A strong storm over a crowded coast can stand above an earthquake that killed many more people, because more people were within its reach.
- Replayed on the years since 2005, its highest days fall on great earthquakes, storms and floods; the highest of each year stands between 66 and 93.
- The value at 90 rests on counting the coast round the Indian Ocean in 2004. Live, the figure has no coast for a tsunami yet, so a great earthquake reads its shaking alone until more is known.
Limits
The figure is Criora’s reading of what the issuing services report. No service issues it, and it never replaces an authority’s warning: for what to do where you are, follow your national or local service.
- It knows what the services report, when they report it. An event no service reports is not in it, and a report that comes late moves it late.
- People are counted where an event’s footprint is known, as for Criora Severity. Where the issuer draws no shape, an earthquake’s footprint is estimated from its magnitude and depth.
- A person within reach of two events counts twice.
- GDACS’s alerts are computed automatically and are not reviewed by experts before they are issued; GDACS asks that they be confirmed before a decision rests on them.
- How often each level comes is taken from two replays of past events, one of them short. It is measured again on the figure’s own history as that grows.
Using the figure
The figure is free to read and to cite under the site’s terms, with Source: Criora and a link. GET /api/v1/world/danger answers the latest reading, the people in harm’s way, its level, the event that weighs most in it and the highest of the 24 hours before; GET /api/v1/world/pulse adds the last 30 days; GET /api/v1/world/danger/history answers the highest of each hour. Every source it reads is listed with its licence in Data sources. GDACS’s alerts are © European Union, under CC BY 4.0, and changed by Criora.
Related
- Criora Severity: how bad each event is
- Live dispatches: the events on the map and in its list
- Changelog: every change to the method