Criora

United States of America

Region Americas Subregion Northern America Income High income: OECD ISO USA

United States of America sits mid-pack overall, with climate the main pressure.

Live events

In real time

Hourly disaster feed, shown alongside the standing risk below. Open the live map →
Standing risk

How risky is United States of America, overall?

The composite and its five dimensions. Higher means more risk.

Composite risk
Medium
40 / 100
Very lowLowMediumHighCritical
  1. Climate
    Medium
    58 / 100
  2. Nature
    Medium
    47 / 100
    ▲ + 0.2 5y
  3. Social
    Low
    25 / 100
  4. Governance
    Low
    36 / 100
  5. Adaptation
    Low
    35 / 100
    ▲ + 2.3 5y
Climate futures

United States of America: outlook from 2050 to 2100

Projected physical change under a moderate (SSP2-4.5) and a high (SSP5-8.5) emissions pathway.

By 2080 under a high-emissions pathway, United States of America is projected to warm +4.3 °C, with annual rainfall changing +44 mm.

Temperature

+4.3 °C

20502080
Higher emissions SSP5-8.5
+3.3 °C → +4.3 °C
Lower emissions SSP2-4.5
+2.7 °C → +3.2 °C

Hottest month +4.4 °C by 2080 (SSP5-8.5).

Precipitation

+44 mm

20502080
Higher emissions SSP5-8.5
+32 mm → +44 mm
Lower emissions SSP2-4.5
+30 mm → +34 mm

Driest month +2 mm by 2080 (SSP5-8.5).

Sea level

United States of America: under high emissions, severe coastal flooding could reach 8 of its largest cities.

Most exposed cities

PopulationFlood depth

Coastal sea-level rise

20502100
Higher emissions SSP5-8.5
+0.21 m → +0.70 m
Lower emissions SSP2-4.5
+0.20 m → +0.52 m

Water stress

32%

20502080
Higher emissions SSP5-8.5
28% → 32%
Current path SSP3-7.0
25% → 22%

Share of land under high or extreme water stress; 21% today.

River flooding

2.5%

20502080
Higher emissions SSP5-8.5
2.2% → 2.5%
Lower emissions SSP2-4.5
2% → 2.4%

Land exposed to a 100-year river flood; 2% today.

Regional estimate for the country's coast (IPCC AR6 median), not the global average.

Projections from public CMIP6 (WorldClim 2.1, 5-model median, against a 1970-2000 baseline), WRI Aqueduct 4.0 and IPCC AR6 data. Monthly and bioclimatic aggregates, not daily-threshold indices. Forward-looking estimates, not a re-scored site risk.

Score a site

But what about your location?

The country score is an average. Get the full risk breakdown for one address or point inside United States of America.

Where exactly?

Type an address, city, or landmark and we resolve it to a precise risk profile for that point.
orpinpoint it on the map
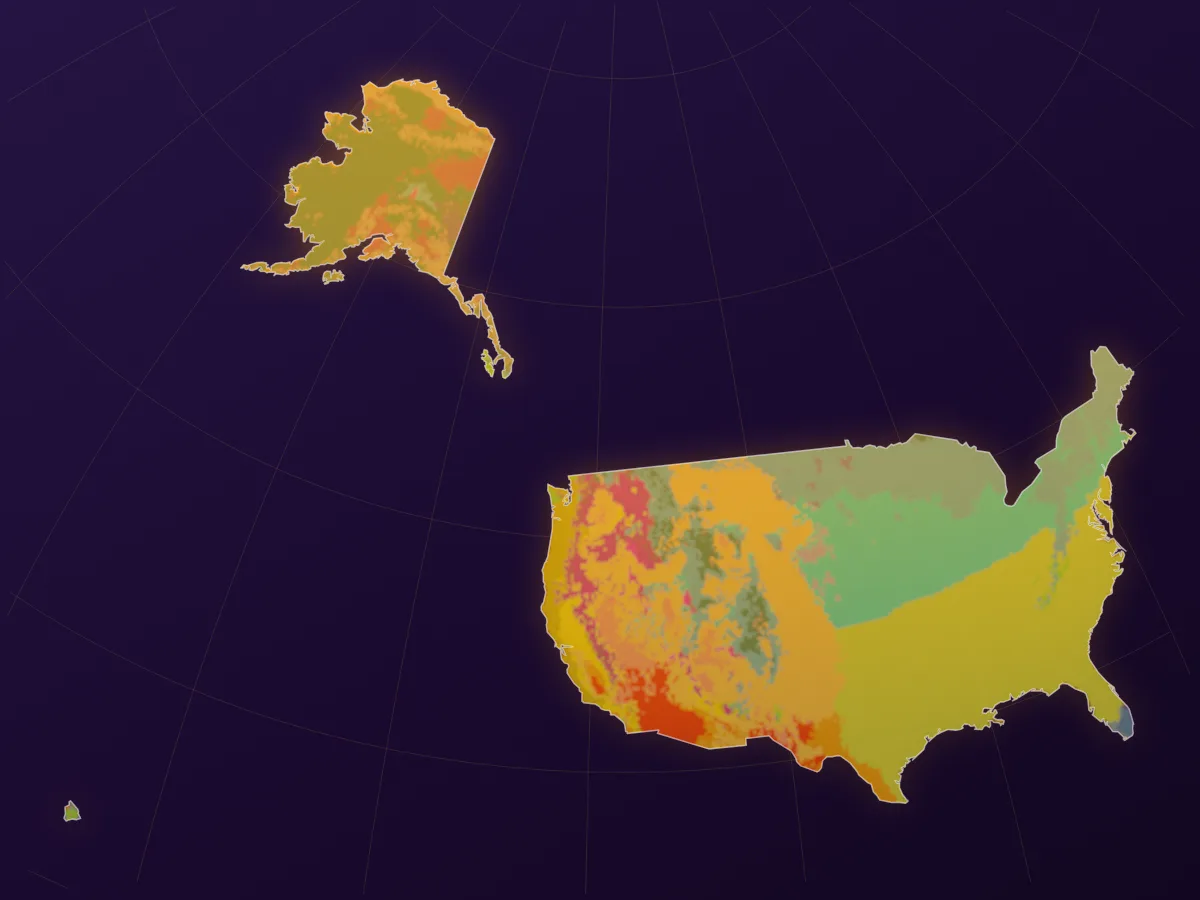
Pinpoint on the map Map of United States of America Open the map →
Hazard exposure

Which hazards threaten United States of America most?

Physical hazard intensity. INFORM Risk Index, 0 to 10.

Flood
High
7.5 / 10
DRR capacity
Low
2.5 / 10
Peers

United States of America in global context

Risk-ranked against its cohorts. Click any country to open its page.

Put two countries head to head

Compare United States of America against any neighbour on all risks and their 5-year trajectory.

Indicators

Indicator panel

Every source-level indicator behind the dimensions above. Sort by score, value, or name.

FAQ

Common questions

Answer-first, drawn from the same data above.

How risky is United States of America?
United States of America sits mid-pack overall, with climate the main pressure. Its overall risk score is 40 out of 100 (medium), blended from World Bank, INFORM Risk Index and ND-GAIN Country Index.
What drives United States of America's risk?
United States of America's highest pressures are climate (58, medium) and nature (47). Its strongest area is social (25).
How might United States of America's climate change by 2080?
Under a high-emissions scenario (SSP5-8.5), about 23% of United States of America's land shifts toward a warmer climate zone by 2080, lifting its climate-hazard pressure index from 70 to 71 out of 100. This Koppen-based outlook is a separate, forward-looking measure from the historical ND-GAIN scores.
How much will United States of America warm by 2080?
Under a high-emissions scenario (SSP5-8.5), United States of America is on track to warm by +4.3 °C by 2080, with annual precipitation changing by +44 mm; under lower emissions (SSP2-4.5) the warming is about +3.2 °C. Based on CMIP6 multi-model projections against a 1970-2000 baseline.
How much will sea levels rise along United States of America's coast?
Coastal sea level along United States of America is projected to rise by +0.70 m by 2100 under a high-emissions scenario (SSP5-8.5), and by about +0.52 m under lower emissions (SSP2-4.5). Based on the regional median of IPCC AR6 projections.
How will water stress change in United States of America?
The share of United States of America under high water stress is projected to move from 21% today to 32% by 2080 under a high-emissions scenario (SSP5-8.5). Based on WRI Aqueduct projections.
How will river-flood exposure change in United States of America?
The share of United States of America exposed to river flooding is projected to move from 2% today to 2.5% by 2080 under a high-emissions scenario (SSP5-8.5). Based on WRI Aqueduct riverine-flood projections.
When was United States of America's risk data last updated?
Updated June 2026, drawing on World Bank, INFORM Risk Index and ND-GAIN Country Index.