

Climate risk in Jinan
Shandong, China · 2.8M people in the urban area
What threatens Jinan most
- Water stress
- Extremely High WRI Aqueduct
- Drought
- High WRI Aqueduct
- River flood
- 0.58 m in a 100-year flood
Tsunamis and landslides are not rated for a single city here. Climate risk profile of China
A 100-year river flood would stand 0.58 m deep in the centre of Jinan.
Shanghai: Dry at the city centre point.

















Jinan's climate in the 2050s
2041-2060 compared with 1991-2020, moderate emissions
By the 2050s, Jinan is projected to have the climate that Suzhou (China) has today.
+1.9°C
Mean temperature over the year
+2°C
Highest in the warmest month
+2°C
Lowest in the coldest month
+8%
Precipitation over the year
Under high emissions, Jinan would have the climate that Suzhou (China) has today.
Share this comparison
How close the match is: 1.4 σ to the climate of Suzhou today, where under 2 is close and over 4 is no match (Mahony et al. 2017). 3 of 3 climate model runs name the same city. Seasonal temperature and rain are compared, not extremes, city heat or the sea.
Where else Jinan stands out
1%
Land burned in an average year
Shanghai: 0%.
Higher than in 83% of the world's 630 large cities
39.7°C
Hottest day of 2025
Shanghai: 37°C.
Higher than in 75% of the world's 630 large cities
Hazards at Jinan
Read at the city's centre and compared with the Atlas's 630 large cities. Moderate emissions is the IPCC's scenario SSP2-4.5.
| Hazard | Jinan | Among large cities | In China |
|---|---|---|---|
| Hot days in 2025, over 35 °C | 33 days | Among large cities: above 73% | In China: 43 of 135 |
| Tropical nights in 2025, over 20 °C | 112 days | Among large cities: above 54% | In China: 74 of 135 |
| Hottest day of 2025 | 39.7°C | Among large cities: above 75% | In China: 34 of 135 |
| Warming by 2050, moderate emissions | +1.9°C | Among large cities: above 45% | In China: 114 of 135 |
| Days with 20 mm of rain or more in 2025 | 9 days | Among large cities: above 48% | In China: 110 of 135 |
| River flood depth, 100-year event | 0.58 m | Among large cities: above 93% | In China: 12 of 135 |
| Coastal flood depth, 100-year event | Dry at the city centre point | ||
| Water stress | Extremely High (>80%) | Among large cities: above 70% | In China: 1 of 135 |
| Drought risk | High | Among large cities: above 50% | In China: 1 of 135 |
| Earthquake shaking, once in 475 years | 0.63 m/s² | Among large cities: above 51% | In China: 57 of 135 |
| Land burned in an average year | 1% | Among large cities: above 83% | In China: 14 of 135 |
| Cyclone wind, once in 100 years | 0 m/s |
Flood depth is read in a single 1 km cell at the city's centre, in today's climate. Other parts of the city can still flood. The country page names the deepest point near a coastal city in 2080, so its figure can be higher. See how deep a river flood reaches around Jinan on the live map
See the land burned around Jinan on the live map


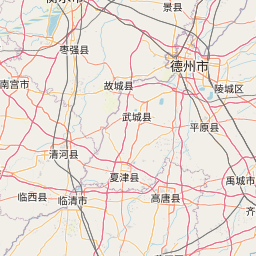
















 1% © OpenStreetMap
Large cities in China
- Shanghai
- Beijing
- Guangzhou
- Shenzhen
- Wuhan
- Tianjin
- Chongqing
- Yangzhou
- Dongguan
- Chengdu
- Xi'an
- Hechi
- Nanjing
- Guiyang
- Harbin
- Ürümqi
- Zhangzhou
- Shiyan
- Changchun
- Dalian
- Zibo
- Hangzhou
- Kunming
- Taiyuan
- Huizhou
- Qingdao
- Yinchuan
- Zhengzhou
- Fuzhou
- Changsha
- Xiangtan
- Lanzhou
- Xiamen
- Lianshan
- Shijiazhuang
- Jilin City
- Wenzhou
- Nanchang
- Nantong
- Nanchong
- Nanning
- Zaozhuang
- Yantai
- Xuzhou
- Linyi
- Haikou
- Zunyi
- Baotou
- Hefei
- Lianyungang
- Suzhou
- Nanyang
- Ningbo
- Tangshan
- Datong
- Jiangmen
- Shucheng
- Fuyang
- Shangqiu
- Wuxi
- Qingyuan
- Hohhot
- Luoyang
- Daqing
- Wanzhou
- Suzhou
- Qiqihar
- Anshan
- Handan
- Yancheng
- Taizhou
- Shantou
- Zhanjiang
- Guilin
- Xiantao
- Zhaoqing
- Weifang
- Xinyang
- Putian
- Luzhou
- Ganzhou
- Liuzhou
- Fushun
- Changde
- Neijiang
- Quanzhou
- Kaifeng
- Huainan
- Baoji
- Suining
- Mianyang
- Heshan
- Yichang
- Heze
- Changzhou
- Luohe
- Yangjiang
- Chifeng
- Xuchang
- Huai'an
- Huzhou
- Liaocheng
- Tianshui
- Liupanshui
- Changzhi
- Weinan
- Jining
- Jiaxing
- Jiujiang
- Leshan
- Anyang
- Shangrao
- Yulin
- Xianyang
- Baoding
- Zigong
- Ankang
- Jinhua
- Zhuzhou
- Xiangyang
- Zhucheng
- Xining
- Xinxiang
- Zhangjiakou
- Yichun
- Shaoguan
- Zhuhai
- Jiamusi
- Hengyang
- Benxi
- Hanzhong
- Qinhuangdao
- Yongzhou
- Baoshan
Cite or embed
Cite this page
In a line
Source: Criora (criora.com), based on ECMWF, NEX-GDDP-CMIP6, WRI, IPCC, GSHAP, GFED500
APA
Criora. (2026). Jinan, China: climate risk profile [Data set]. Retrieved November 2, 2026, from https://criora.com/atlas/CHN/jinan BibTeX
@misc{criora_atlas_CHN_jinan_2026,
  author = {{Criora}},
  title = {Jinan, China: climate risk profile},
  year = {2026},
  url = {https://criora.com/atlas/CHN/jinan},
  urldate = {2026-11-02}
} Each reading stays under its source's terms; the sources are named on this page.
Embed on your site
<iframe src="https://criora.com/embed/atlas/CHN/jinan" title="Jinan, China: climate risk, by Criora" width="100%" height="140" loading="lazy" style="max-width:420px;border:0"></iframe>
<p><a href="https://criora.com/atlas/CHN/jinan?ref=embed" rel="nofollow">Source: Criora</a></p>
Free, no account needed. The widget has no script and shows the figures of this page. Keep its link to the source.