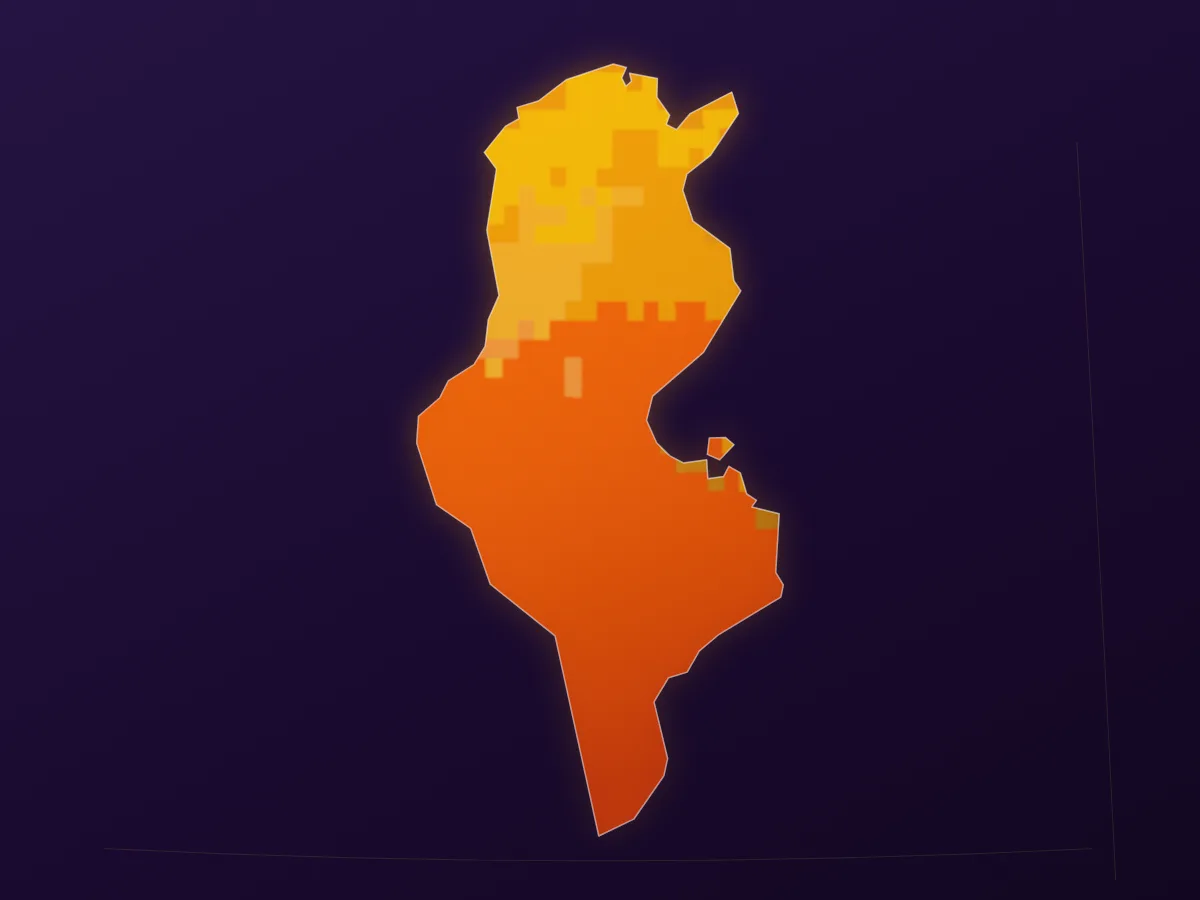
+3.7 °C
Temperature
20502080
- Higher emissions SSP5-8.5
- +2.8 °C → +3.7 °C
- Lower emissions SSP2-4.5
- +2.1 °C → +2.5 °C
Hottest month +5.4 °C by 2080 (SSP5-8.5).


Tunisia: mid-pack overall, with governance the main pressure.
The composite and its five dimensions. Higher means more risk.
Medium 47 / 100
Physical hazard intensity. INFORM Risk Index, 0 to 10.
Risk-ranked against its cohorts. Click any country to open its page.
Compare with any neighbour on all risks and their 5-year trajectory.
Projected physical change under a moderate (SSP2-4.5) and a high (SSP5-8.5) emissions pathway.
By 2080 under a high-emissions pathway, Tunisia is projected to warm +3.7 °C, with annual rainfall changing -14 mm.
+3.7 °C
Hottest month +5.4 °C by 2080 (SSP5-8.5).
-14 mm
Driest month 0 mm by 2080 (SSP5-8.5).
55%
Share of land under high or extreme water stress; 54% today.
0.2%
Land exposed to a 100-year river flood; 1.5% today.
Tunisia: under high emissions, a 100-year coastal flood in 2080 could reach 8 of its largest cities.
Max depth: the deepest water within 12 km of the city center in a 100-year coastal flood in 2080, under RCP8.5 with high-end sea-level rise (95th percentile), ignoring flood defenses and land subsidence. Source: WRI Aqueduct Floods.
Regional estimate for the country's coast (IPCC AR6 median), not the global average.
Projections from public CMIP6 (WorldClim 2.1, 5-model median, against a 1970-2000 baseline), WRI Aqueduct 4.0 and IPCC AR6 data. Monthly and bioclimatic aggregates, not daily-threshold indices. Forward-looking estimates, not a re-scored site risk.
Every source-level indicator behind the dimensions above. Sort by score, value, or name.
Renewable Electricity Share | 2.82 % of total | 97.2 |
Renewable Energy Share | 11.6 % of total energy | 88.0 |
Fossil Fuel Consumption | 86.8 % of total | 86.3 |
Land Surface Temperature | 32.8 deg C change | 76.3 |
Energy Imports | 53.1 % of energy use | 73.1 |
Cooling Degree Days | 2997 degree days | 41.0 |
Flood Risk | 3.70 0-10 | 37.0 |
PM2.5 Air Pollution | 24.2 ug/m3 | 24.0 |
Energy Intensity | 3.70 MJ/$2017 PPP GDP | 21.3 |
Heating Degree Days | 1326 degree days | 9.1 |
CO2 Emissions Per Capita | 2.45 metric tons | 7.7 |
N2O Emissions Per Capita | 0.28 kt CO2e per capita | 6.4 |
Energy Use Per Capita | 956 kg oil eq per capita | 5.3 |
Heat Index | 2.44 index | 1.8 |
Access to Clean Fuels | 99.9 % population | 0.1 |
Coal Electricity Share | 0.00 % of total | 0.0 |
Forest Area | 4.54 % of land | 95.2 |
Protected Areas | 5.20 % of land | 94.8 |
Dam Capacity | 0.94 0-1 | 94.4 |
Agricultural Capacity | 0.91 0-1 | 91.1 |
Freshwater Withdrawal | 92.1 % of internal resources | 89.5 |
Health Expenditure Per Capita | 0.89 0-1 | 89.2 |
Freshwater Withdrawal Rate | 0.79 0-1 | 78.9 |
Quality of Trade Infrastructure | 0.74 0-1 | 74.4 |
Agricultural Land | 62.4 % of land | 73.7 |
Urban Concentration | 0.68 0-1 | 68.3 |
Projected Vector Disease Change | 0.66 0-1 | 65.8 |
Projected Cereal Yield Change | 0.65 0-1 | 65.4 |
Food Production Index | 110 index | 63.8 |
Tsunami Risk | 5.90 0-10 | 59.0 |
Energy Import Dependency | 0.57 0-1 | 57.2 |
Projected Biome Distribution Change | 0.56 0-1 | 56.5 |
Earthquake Risk | 5.40 0-10 | 54.0 |
Population Below 5m | 0.54 0-1 | 54.0 |
Environmental Treaties Engagement | 0.49 0-1 | 49.0 |
Age Dependency Ratio | 0.48 0-1 | 47.8 |
Projected Hydropower Change | 0.44 0-1 | 43.7 |
Projected Marine Biodiversity Loss | 0.42 0-1 | 41.9 |
Projected Warm Period Change | 0.38 0-1 | 38.1 |
Rural Population | 0.32 0-1 | 31.7 |
Protected Biome Areas | 0.31 0-1 | 30.6 |
Access to Reliable Drinking Water | 0.26 0-1 | 26.1 |
Agriculture GDP Share | 9.33 % of GDP | 26.0 |
Natural Capital Dependency | 0.24 0-1 | 24.0 |
Paved Roads | 0.24 0-1 | 23.9 |
Projected Climate-Related Deaths | 0.21 0-1 | 21.2 |
Food Import Dependency | 0.21 0-1 | 20.8 |
Projected Population Change | 0.20 0-1 | 19.5 |
Access to Improved Sanitation | 0.19 0-1 | 19.1 |
Projected Sea Level Rise Impact | 0.17 0-1 | 16.5 |
Projected Groundwater Change | 0.15 0-1 | 15.2 |
Water Bodies Extent | 84.9 % of land | 15.1 |
Ecological Footprint | 0.15 0-1 | 14.7 |
Dependency Ratio | 0.14 0-1 | 14.5 |
Projected Flood Hazard Change | 0.12 0-1 | 11.7 |
Water Dependency Ratio | 0.09 0-1 | 9.1 |
Child Malnutrition | 0.09 0-1 | 8.7 |
Slum Population | 0.08 0-1 | 7.7 |
Threatened Mammal Species | 14.0 count | 7.3 |
Water Stress | 98.1 % | 2.5 |
Natural Resource Depletion | 1.38 % of GNI | 2.4 |
Forest Depletion | 0.21 % of GNI | 1.2 |
Tree Cover Loss | 2079 hectares | 0.0 |
Projected Annual Runoff Change | 0.00 0-1 | 0.0 |
Electricity Access | 0.00 0-1 | 0.0 |
Hospital Beds | 2.42 per 1,000 | 83.4 |
Gender Labor Ratio | 40.8 ratio F/M | 65.6 |
Overweight Adults | 57.4 % adults | 58.5 |
Labor Participation | 51.2 % (15+) | 57.6 |
Net Migration | -14001 persons | 54.6 |
GDP Growth | 0.04 % annual | 53.4 |
Shared Prosperity Growth | 1.03 % annual | 45.3 |
Unmet Contraception Need | 16.5 % | 43.0 |
Unemployment Rate | 15.1 % | 42.8 |
Primary School Enrollment | 104 % gross | 37.6 |
Aid Dependency | 3.70 0-10 | 37.0 |
Income Share Bottom 20% | 7.70 % | 35.2 |
Uprooted People | 3.30 0-10 | 33.0 |
Internet Users | 72.4 % population | 31.0 |
Gini Coefficient | 33.7 0-100 | 31.0 |
Life Expectancy | 76.5 years | 30.9 |
Education Expenditure | 18.1 % of govt | 30.1 |
Safe Drinking Water | 74.3 % population | 27.4 |
Development and Deprivation | 2.60 0-10 | 26.0 |
Aging Population | 9.17 % population | 21.8 |
Fertility Rate | 1.83 births per woman | 20.5 |
Adult Literacy Rate | 85.2 % | 20.3 |
Sanitation Access | 81.1 % population | 19.4 |
ESG Performance Score | 2.35 0-100 | 19.0 |
Poverty Rate (National) | 16.6 % population | 18.0 |
Under-5 Mortality Rate | 12.9 per 1,000 | 10.1 |
Communicable Disease Deaths | 7.14 % | 9.2 |
Children Under 5 | 0.70 0-10 | 7.0 |
Food Security | 0.40 0-10 | 4.0 |
Health Conditions | 0.30 0-10 | 3.0 |
Undernourishment | 3.20 % population | 1.4 |
Population Density | 78.0 people/km2 | 0.4 |
Access to Electricity | 100 % population | 0.0 |
Recent Shocks | 0.00 0-10 | 0.0 |
Patent Applications | 180 count | 100.0 |
Scientific Articles | 5730 count | 99.4 |
R&D Expenditure | 0.75 % of GDP | 87.7 |
Legal Rights Strength | 3.00 0-12 | 75.0 |
Women in Parliament | 16.2 % seats | 73.5 |
Political Stability | -0.63 -2.5 to +2.5 | 62.6 |
Regulatory Quality | -0.62 -2.5 to +2.5 | 62.4 |
INFORM Governance Index | 5.80 0-10 | 58.0 |
Control of Corruption | -0.34 -2.5 to +2.5 | 56.8 |
Government Effectiveness | -0.30 -2.5 to +2.5 | 56.0 |
Voice and Accountability | -0.21 -2.5 to +2.5 | 54.3 |
Rule of Law | -0.14 -2.5 to +2.5 | 52.8 |
Healthcare Access | 3.50 0-10 | 35.0 |
Physical Infrastructure | 2.50 0-10 | 25.0 |
Communication Infrastructure | 2.40 0-10 | 24.0 |
Innovation (Readiness) | 0.07 0-1 | 92.7 |
Education (Readiness) | 0.23 0-1 | 77.0 |
Control of Corruption (Readiness) | 0.35 0-1 | 65.4 |
Rule of Law (Readiness) | 0.38 0-1 | 61.8 |
Political Stability (Readiness) | 0.46 0-1 | 53.9 |
Regulatory Quality (Readiness) | 0.48 0-1 | 51.8 |
Social Inequality (Readiness) | 0.51 0-1 | 49.3 |
ICT Infrastructure | 0.52 0-1 | 48.3 |
Doing Business Score | 0.53 0-1 | 46.6 |
These indicators have site-level resolution. Score your exact location.
Score a site in Tunisia →The country score is an average. Get the full risk breakdown for one address or point inside Tunisia.
Type an address, city, or landmark and we resolve it to a precise risk profile for that point.
Answer-first, drawn from the same data above.
Tunisia: mid-pack overall, with governance the main pressure. Its overall risk score is 47 out of 100 (medium), blended from World Bank, INFORM Risk Index and ND-GAIN Country Index.
Tunisia's highest pressures are governance (68, high) and adaptation (57). Its strongest area is social (28).
Under a high-emissions scenario (SSP5-8.5), about 6% of Tunisia's land shifts toward a drier, more arid zone by 2080, lifting its climate-hazard pressure index from 67 to 66 out of 100. This Koppen-based outlook is a separate, forward-looking measure from the historical ND-GAIN scores.
Under a high-emissions scenario (SSP5-8.5), Tunisia is on track to warm by +3.7 °C by 2080, with annual precipitation changing by -14 mm; under lower emissions (SSP2-4.5) the warming is about +2.5 °C. Based on CMIP6 multi-model projections against a 1970-2000 baseline.
Coastal sea level along Tunisia is projected to rise by +0.76 m by 2100 under a high-emissions scenario (SSP5-8.5), and by about +0.54 m under lower emissions (SSP2-4.5). Based on the regional median of IPCC AR6 projections.
The share of Tunisia under high water stress is projected to move from 54% today to 55% by 2080 under a high-emissions scenario (SSP5-8.5). Based on WRI Aqueduct projections.
The share of Tunisia exposed to river flooding is projected to move from 1.5% today to 0.2% by 2080 under a high-emissions scenario (SSP5-8.5). Based on WRI Aqueduct riverine-flood projections.
Updated September 2026, drawing on World Bank, INFORM Risk Index and ND-GAIN Country Index.